Why a wireless link behaves differently in Gauteng than in KwaZulu Natal
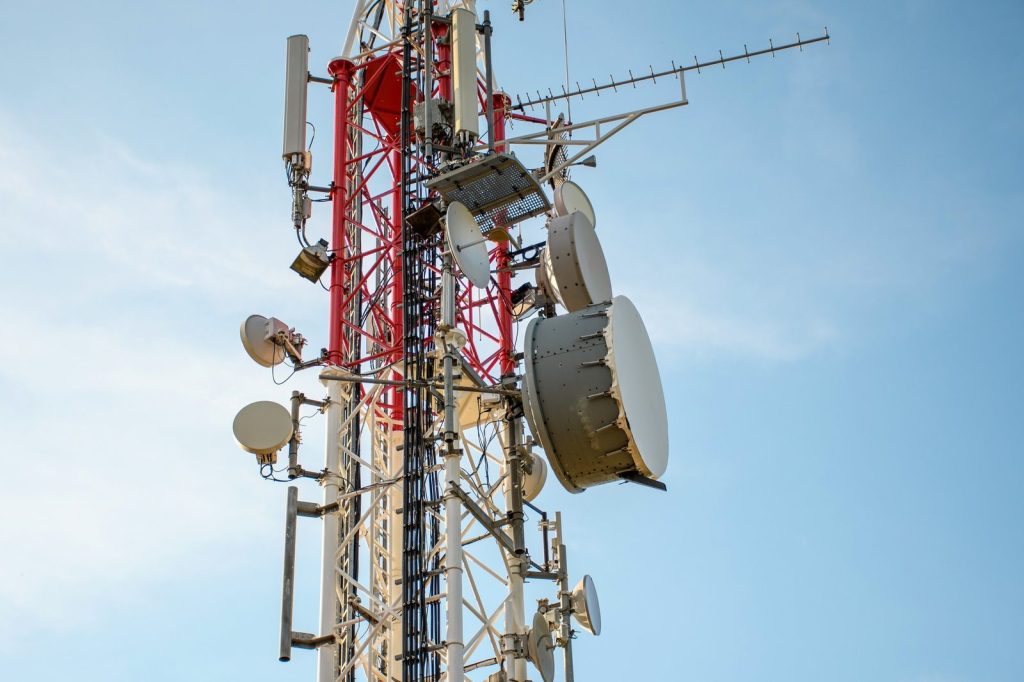
Rapidnet runs two networks in very different places. One sits on the Highveld at 1,550 to 1,650 metres above sea level. The other is on the KwaZulu Natal coast, near sea level and in far more humid air.
The two networks carry the same technology. What differs is the atmosphere above them, the ground under them and the buildings in the way. This is what that means for a radio link, and what we do about it.
It is also the reason a link over a similar distance can behave quite differently between a dense suburban area and open semi-rural ground with nothing but air between the two ends. Distance is only one variable, and often not the decisive one.
Two atmospheres
Height above sea level matters less than what that height does to the air.
The Highveld sits high, so the air is thinner and, in our experience, generally drier. Thinner air reduces the amount of water vapour in the path, and water vapour absorbs radio energy. That helps a little at every frequency we use.
The coast sits close to sea level in air that holds far more moisture, at higher pressure, with a shorter average path to the sea. Everything about it is more variable. Refractivity changes through the day, and the sea surface is a large reflector sitting directly below many of our paths.
Those two facts drive most of the differences below.
Rain: why the annual total misleads
Ask anyone which is wetter, Johannesburg or Durban, and the answer is obvious. Durban. The record agrees.
Look at eleven years of historical rainfall for the two cities, 2015 to 2025.
| Johannesburg | Durban | |
|---|---|---|
| Rain per year | 638 mm | 893 mm |
| Days with at least 1 mm | 91 | 110 |
| Days with at least 10 mm | 18 | 26 |
| Days with at least 25 mm | 3 | 6 |
| Average on a wet day | 6.8 mm | 7.8 mm |
Durban gets more rain, on more days, in heavier daily totals. That is worth stating plainly, because a common assumption about the two cities is that the Highveld is the harsher place for weather. On daily totals it is not.
None of that tells you what happens to a link.
The number that matters is the rate, not the total
Rain affects a radio signal in proportion to how hard it is falling at the moment in question, not how much fell that day.
A day with 30 mm of rain can mean two very different things.
- a slow drizzle across sixteen hours, or
- a single storm that empties 30 mm in forty minutes.
The models treat those very differently. ITU-R P.838 sets out the standard method for predicting rain attenuation, and the input it needs is rainfall rate in millimetres per hour, along with frequency and polarisation.
A 40-minute Gauteng thunderstorm that floods a highway and empties a large car park leaves daily records looking unremarkable. What it does to a 60GHz link in those 40 minutes is a different order of event from two days of KZN steady rain.
This is where our operational observation and the climate record part company, and it is worth being honest about that. The dataset says Durban is the wetter city. What we see on the two networks says the driving variable is the shape of the rain, not the volume.
A gridded climate model cannot settle that question. A thunderstorm lasting thirty to forty minutes is averaged into an hourly cell that reads as an unremarkable amount of rain. To see the difference you need a rain gauge and a link that logs when it degraded.
What each band does in the wet
Not all rain is equal, because not all bands are.
5GHz and 6GHz survive a great deal. Wavelength matters. At these frequencies the drops are small relative to the wavelength, and attenuation through heavy rain is modest. A 5GHz link carrying a household or a small office usually stays up through a Gauteng storm, with some slowdown at the peak.
60GHz and 80GHz are a different proposition. At 60GHz the oxygen in the air absorbs the signal directly, which is the subject of ITU-R P.676. That absorption is a limitation on range and, at the same time, a form of protection, because a signal that dies quickly also stops interfering with the next tower along. In rain, the same small wavelength that protects the link from other users makes it vulnerable to water. Heavy drops approach the wavelength in size, and attenuation climbs sharply.
The practical consequence is that 60GHz and 80GHz links are engineered with more margin, over shorter paths, and with a clear expectation that severe weather will take them down briefly. That is a design choice, not a fault.
What we do about it
Where a site needs to stay up through a storm, a lower band is the answer, at the cost of capacity. Where the site needs capacity and can tolerate a brief interruption, the higher bands earn their place.
The same logic applies to link lengths. A 60GHz link at a kilometre has margin to spare. The same radio over three times the distance is not, and no amount of antenna gain fixes physics.
Beam width over distance
An antenna’s beam width and its range are bound together.
A narrow beam concentrates energy, so the signal carries further and interferes with less. The cost is that it must be aimed precisely, and that moving it slightly moves the footprint a great deal at distance. A wide beam is forgiving to aim and covers more ground, but spreads the same energy over a larger area, so it arrives weaker.
The useful way to think about it. Tilting a narrow beam by a fraction of a degree moves the coverage footprint by metres at one kilometre and by many metres at five. At long range the aiming tolerance in degrees becomes tiny, and the mechanical stability of the mast starts to matter more than the radio settings.
That is why long paths get more attention at installation than short ones. Not because the equipment is more delicate, but because the geometry is less forgiving.
The Fresnel zone
Most of the energy does not travel exactly along the straight line between two antennas. It spreads into an elliptical volume around that line, called the first Fresnel zone, and that whole volume needs to be clear for the path to behave as intended.
The rule of thumb, set out on the Fresnel zone reference, is that the first zone should be at least 60 percent clear, and ideally 80 percent clear.
The zone is widest at the midpoint of the path and narrows to nothing at each antenna. A taller mast does not solve everything, because the zone grows as the path lengthens and at the midpoint it is at its widest. Two sites with a perfect-looking line of sight can still fail if something intrudes into the lower part of that ellipse.
At 60GHz the zone is narrower than at 5GHz, which sounds helpful, and is, until you remember that the same short wavelength means the signal also diffracts far less around anything that does intrude.
What gets in the way
Trees. The most common problem, and the one that most often gets worse without anyone touching the link. A path surveyed in winter and installed in spring has a different clearance in two years. The Fresnel zone gives you the margin you need only if you survey for the tree it will become.
Hills and terrain. Visible on a map as a profile between the two ends.
Buildings. A building between the two sites is the obvious case. A building that reflects energy into the path is the less obvious case and usually the harder one.
Large flat reflective roofs. The Midrand area has a number of large warehouses, and we have had issues there. A long metal roof is a large, flat, conductive surface. Depending on the geometry it can act as a specular reflector, sending a second copy of the signal to the receiver slightly later than the direct path. The two arrive out of phase and interfere with each other. A silver or metallic-coated roof behaves the same way.
The result is a link that tests well and performs badly, with a signal strength that reads acceptable while throughput and stability do not match it.
Where you put the antenna matters as much as what you point at
There is a design answer, and it costs cable.
Rather than mounting at one end of the building and firing over the entire length of the roof, mount closer to the far side and accept a longer cable run. Eighty metres of additional cable is inexpensive. A link that fights its own reflected path for the next five years is not.
This is the sort of decision that gets made once at installation and is very awkward to correct later, which is why our site survey spends time on it.
Water, reflectivity and the evaporation duct
Large bodies of water, whether a dam or the sea, introduce two separate effects, and both are stronger on a warm, still day than at dawn.
Reflection. A smooth water surface is a good reflector. It behaves much like a mirror for radio at shallow angles, sending energy into paths that were not in the design. As with a metal roof, the problem is not the reflected signal on its own, it is the arrival of a second path alongside the direct one. Wind helps here, because a choppy surface scatters rather than reflects. Glassy water is the harder case.
Ducting. The layer of air immediately above water can trap radio energy and carry it far beyond the horizon. This is the evaporation duct, and it forms because water evaporates into the air above it, changing the refractivity near the surface.
The diurnal behaviour is well documented. A study of over-the-horizon links in the South China Sea measured a daily fluctuation of roughly 50 dB in path loss, with the highest path loss early in the morning (06:00 to 08:00), when the duct is shallowest, and the lowest late in the afternoon (17:00 to 19:00), when it is deepest.
Read that carefully, because it is the opposite of the intuitive guess. The duct deepens as the surface warms through the day and collapses overnight. So over-water paths are at their worst around dawn, not at midday.
Two caveats on applying it here. That study is tropical and over open sea. And the geometry matters. On the KwaZulu Natal coast, the sun comes up low and directly over the water, which is a different set of angles to a path running along a coast or over an inland dam. Our own insight is on the east coast at Durban. We would not claim the same pattern holds on the west coast or on an inland dam path, and anyone stating it as a universal law is guessing.
What we do know is that water in the path changes the design, and that the change is not constant through the day.
What all of this means in practice
Three things.
Distance on a map tells you very little. A four kilometre path across open semi-rural ground and a four kilometre path over a suburb full of reflective roofs are not the same engineering problem.
The survey is the design. Elevation, tree growth, what the antenna is mounted to, what is under the path and what the ground reflects. None of that is in the radio specification, and all of it decides whether the link works in two years.
Weather is a rate, not a total. The annual rainfall figure for a city says nothing about the forty minutes that will actually stress a 60GHz link.
If you want a link assessed properly, get in touch and we will look at the actual path rather than the straight-line distance on a map.